
Page 38 - 林口醫研部2022三月電子報
P. 38
•FIGURE 1. Clustering was based on the log2 expression FC of 17 indicated
genes using the R pheatmap package. Numbers in the heatmap represented
the fold-changes and the P value calculated by Wilcoxon test for each gene.
Color scale represented log2 fold-change from -2 (blue) to 4 (red). (C)
Principal components analysis (PCA) of gene expression fold changes
between all treatments. Colors indicated different treatments. Shapes
indicated different time points.
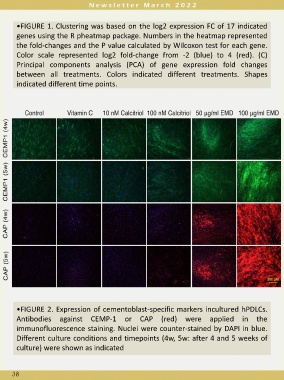
•FIGURE 2. Expression of cementoblast-specific markers incultured hPDLCs.
Antibodies against CEMP-1 or CAP (red) were applied in the
immunofluorescence staining. Nuclei were counter-stained by DAPI in blue.
Different culture conditions and timepoints (4w, 5w: after 4 and 5 weeks of
culture) were shown as indicated
38