
Page 41 - 林口醫研部2022三月電子報
P. 41
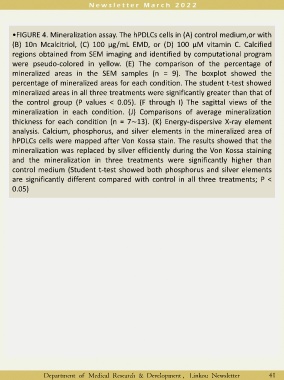
•FIGURE 4. Mineralization assay. The hPDLCs cells in (A) control medium,or with

       (B) 10n Mcalcitriol, (C) 100 μg/mL EMD, or (D) 100 μM vitamin C. Calcified
       regions obtained from SEM imaging and identified by computational program

       were pseudo-colored in yellow. (E) The comparison of the percentage of

       mineralized areas in the SEM samples (n = 9). The boxplot showed the
       percentage of mineralized areas for each condition. The student t-test showed

       mineralized areas in all three treatments were significantly greater than that of

       the control group (P values < 0.05). (F through I) The sagittal views of the
       mineralization in each condition. (J) Comparisons of average mineralization

       thickness for each condition (n = 7∼13). (K) Energy-dispersive X-ray element

       analysis. Calcium, phosphorus, and silver elements in the mineralized area of
       hPDLCs cells were mapped after Von Kossa stain. The results showed that the

       mineralization was replaced by silver efficiently during the Von Kossa staining

       and the mineralization in three treatments were significantly higher than

       control medium (Student t-test showed both phosphorus and silver elements
       are significantly different compared with control in all three treatments; P <

       0.05)


                     Department  of Medical  Research &  Development ,  Linkou Newsletter                                 41