
Page 37 - 林口醫研部2022三月電子報
P. 37
‣圖表
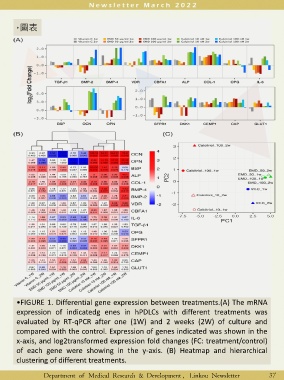
•FIGURE 1. Differential gene expression between treatments.(A) The mRNA
expression of indicatedg enes in hPDLCs with different treatments was
evaluated by RT-qPCR after one (1W) and 2 weeks (2W) of culture and
compared with the control. Expression of genes indicated was shown in the
x-axis, and log2transformed expression fold changes (FC: treatment/control)
of each gene were showing in the y-axis. (B) Heatmap and hierarchical
clustering of different treatments.
Department of Medical Research & Development , Linkou Newsletter 37