
Page 50 - @林口醫研部201912電子報
P. 50
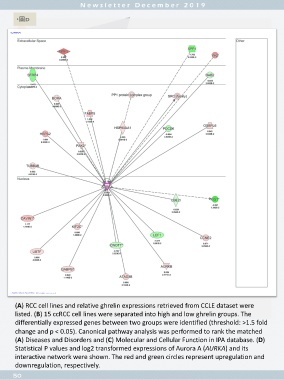
‣圖D


        (A) RCC cell lines and relative ghrelin expressions retrieved from CCLE dataset were

        listed. (B) 15 ccRCC cell lines were separated into high and low ghrelin groups. The
        differentially expressed genes between two groups were identified (threshold: >1.5 fold

        change and p < 0.05). Canonical pathway analysis was performed to rank the matched
        (A) Diseases and Disorders and (C) Molecular and Cellular Function in IPA database. (D)
        Statistical P values and log2 transformed expressions of Aurora A (AURKA) and its

        interactive network were shown. The red and green circles represent upregulation and
        downregulation, respectively.

       50