
Page 36 - 2021年 林口醫研部 9月電子報
P. 36
‣圖表
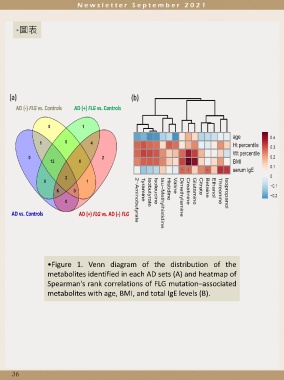
•Figure 1. Venn diagram of the distribution of the
metabolites identified in each AD sets (A) and heatmap of
Spearman's rank correlations of FLG mutation–associated
metabolites with age, BMI, and total IgE levels (B).
36