
Page 54 - 2021年 林口醫研部 9月電子報
P. 54
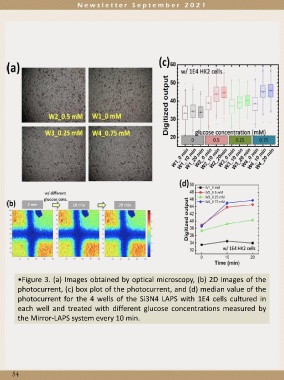
•Figure 3. (a) Images obtained by optical microscopy, (b) 2D images of the

         photocurrent, (c) box plot of the photocurrent, and (d) median value of the

         photocurrent for the 4 wells of the Si3N4 LAPS with 1E4 cells cultured in

         each well and treated with different glucose concentrations measured by
         the Mirror-LAPS system every 10 min.


      54