
Page 53 - 2021年 林口醫研部 9月電子報
P. 53
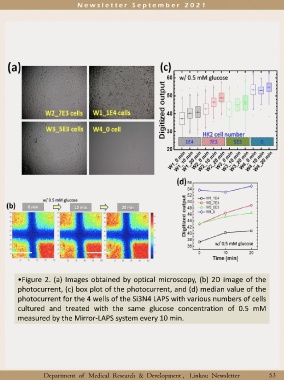
•Figure 2. (a) Images obtained by optical microscopy, (b) 2D image of the

         photocurrent, (c) box plot of the photocurrent, and (d) median value of the

         photocurrent for the 4 wells of the Si3N4 LAPS with various numbers of cells

         cultured and treated with the same glucose concentration of 0.5 mM
         measured by the Mirror-LAPS system every 10 min.


                     Department  of Medical  Research &  Development ,  Linkou Newsletter                                 53