Page 58 - 林口長庚醫研部電子報-2019年3月刊
P. 58

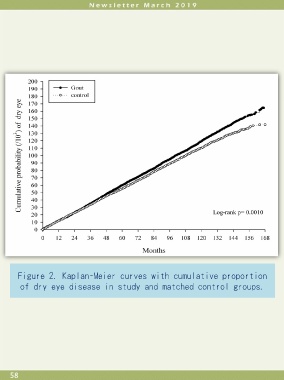
Figure 2. Kaplan-Meier curves with cumulative proportion

          of dry eye disease in study and matched control groups.


      58
   53   54   55   56   57   58   59   60   61   62   63